
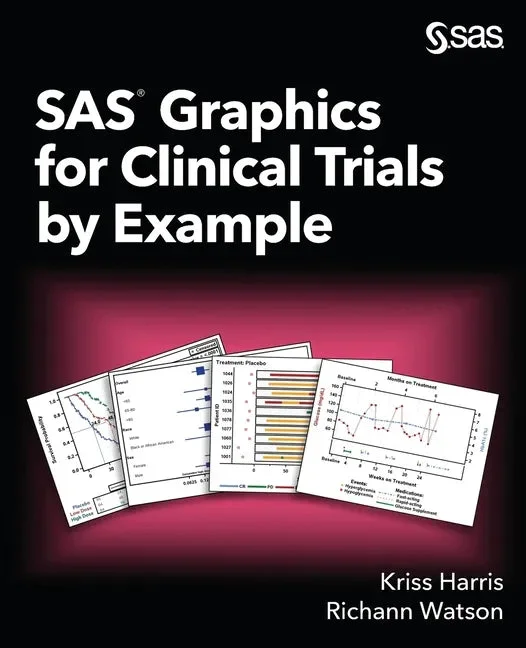
Description
by
Kriss Harris (Author),
Richann Watson (Author)
Create industry-compliant graphs with this practical guide for professionals
Analysis of clinical trial results is easier when the data is presented in a visual form. However, clinical graphs must conform to specific guidelines in order to satisfy regulatory agency requirements. If you are a programmer working in the health care and life sciences industry and you want to create straightforward, visually appealing graphs using SAS, then this book is designed specifically for you. Written by two experienced practitioners, the book explains why certain graphs are requested, gives the necessary code to create the graphs, and shows you how to create graphs from ADaM data sets modeled on real-world CDISC pilot study data.
SAS Graphics for Clinical Trials by Example demonstrates step-by-step how to create both simple and complex graphs using Graph Template Language (GTL) and statistical graphics procedures, including the SGPLOT and SGPANEL procedures. You will learn how to generate commonly used plots such as Kaplan-Meier plots and multi-cell survival plots as well as special purpose graphs such as Venn diagrams and interactive graphs. Because your graph is only as good as the aesthetic appearance of the output, you will learn how to create a custom style, change attributes, and set output options. Whether you are just learning how to produce graphs or have been working with graphs for a while, this book is a must-have resource to solve even the most challenging clinical graph problems.
Number of Pages: 268Dimensions: 0.56 x 9.25 x 7.5 INPublication Date: November 25, 2020




Reviews
There are no reviews yet.