
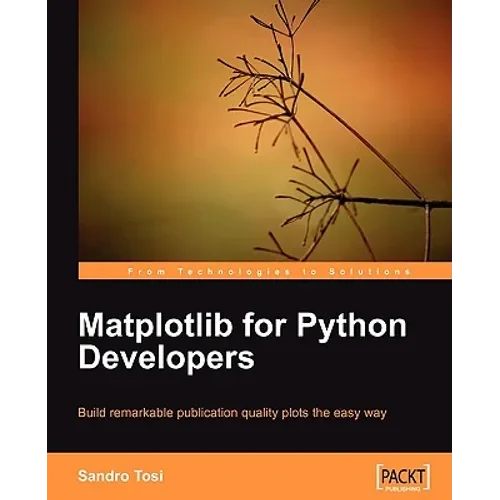
Description
Report copyright infringement
by
Sandro Tosi (Author)
Providing appealing plots and graphs is an essential part of various fields such as scientific research, data analysis, and so on. Matplotlib, the Python 2D plotting library, is used to produce publication-quality figures in a variety of hardcopy formats and interactive environments across platforms. This book explains creating various plots, histograms, power spectra, bar charts, error charts, scatter-plots and much more using the powerful Matplotlib library to get impressive out-of-the-box results.
Number of Pages: 308Dimensions: 0.67 x 9.32 x 7.52 INPublication Date: November 09, 2009



Reviews
There are no reviews yet.